3.31.2012

Expecting to see next Monday in green. Target may be 1414 - 1416

Five previous times we saw at least 2 green days after 3 consecutive red down day before the 1st bounce green day, so if history repeats, we'll see at least the green day next Monday.

According to my geometry analysis, a healthy bullish market should gain the [1422 -1428] zone within next 2 days. Otherwise the uptrend we are in from October 4, 2011 is weakening.

My bullish scenario would favor the [1414 - 1416] zone to be tested and hold by next Monday.

No need to say, a close in red next Monday would be a frustrated look for bulls.

3.30.2012

Bull target today could be 1408.60 - 1410.00 and there may be next three green days ahead

My "buy on [1392.00 - 1397.20] respected" worked perfectly yesterday and I expect that bulls could leave their trace at 1408.60 - 1410.00 today.
Moreover, I expect that there would be 3 green day ahead.
Trading:
Dips are chances to buy. Moreover holding long position for 2-3 days could be optimal.


3.29.2012

[1392.00 - 1397.20] zone is the confluence of very short, short and medium term rising trend lines that a healthy bullish market wants to respect.

12.00pm
I think Buy signal is almost confirmed. Patient bulls may buy when prices soften. 


[1392.00 - 1397.20] zone is the confluence of very short, short and medium term rising trend lines that a healthy bullish market wants to respect.
[1386 - 1389] zone is where bulls may be at risk if it is not hold.
If today the SPX closes in red, we may expect a big bounce after three consecutive days in red in the bullish market.
All that means if [1392.00 - 1397.20] is respected at close and the index is in red at close, it would be a big chance to buy for one or two rebound next days.

3.28.2012

We may see some further pullbacks to 1407.00 - 1409.18 before a tradable bounce

My target 1423.80 coundn't be met. The intraday bull flag pattern fail at the end of the transaction day.
I expect some further pullbacks, maybe 1407.00 - 1409.18, before a tradable bounce.

3.27.2012

We may see SPX leaving her trace at 1423.80/1424.60 for today

Not much to say except to admit that Bulls were very aggressive and they worked out the bull flag pattern perfectly.
We may see SPX leaving her trace at 1423.80/1424.60 today.

3.25.2012

Seems to me that a bull flag is in progress

3/23/2012 Bull-Bears talk: 
Bear was aggressive at the open and had maintained his pressure on bull for almost first 43mins. Bear made a slightly lower low at 1386.97, however he couldn't find alliances then and quickly retreated and returned the control of the game to bull for the rest of the trading day. 
Bull expressed his impatience when defended early and at a higher level than technically calculated (1386.97 instead of 1386 - more exactly recalculated = 1385.74). 
The index closed in green after making intraday high at 1399.18, a little bit short from my target 1401.48.
The short-term rising trend-line showed in the Friday chart was respected.
The Bull-Bear battle last Friday and the overall picture make me a favor given to bull next Monday.
Pattern talk: 
Seems to me that a bull flag is in progress, that will favor a higher odds for an upward exit at the 3rd-touch with the upper descending line.
Day Trade:
My evaluated support/resistances are [1390.00 - 1393.00]/[1401.50 - 1403.60].

3.23.2012

Bull hopes and may attack for 1401.48 today or intraday

Bulls hope and may attack today because bears were unable to breach the 1386 support line.
All short, medium and long term trend lines for bull are intact after 3 days pullback.
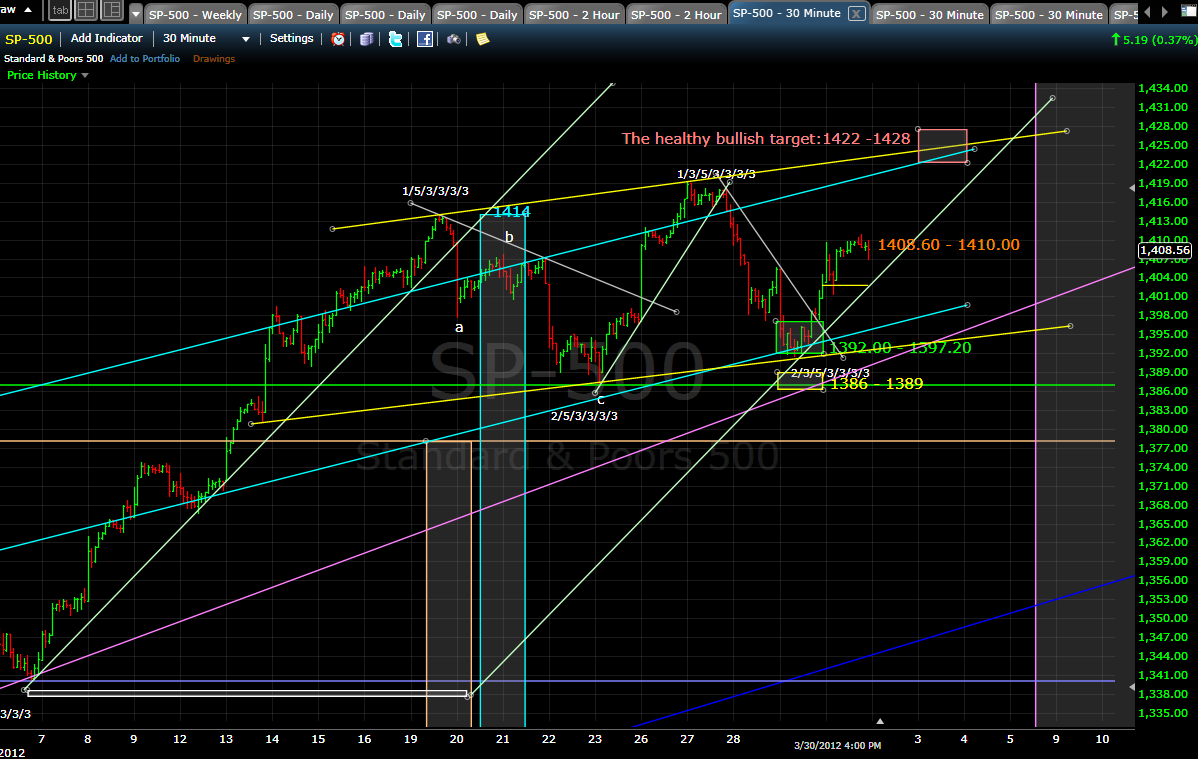
Technically I think the pullback can be considered as the the correction waves (a,b,c) of the 1st wave of the wave 5 of  wave 3/3/3/3.

In the 5' frame it seems that a double bottom is in forming and if the market can continue bouncing from here, my 1st target would be 1401.48 or 0.61% for today or intraday.
Cautious bull will not rule out the possibility that one lower low may be seen because from the 5' frame also seems that a falling wedge is in progress. The falling wedge is a reversal pattern therefore a lower low is a chance to buy.

3.22.2012

The weakly rebound invalidated my call for "1422.40 short term target met without testing 1397.68 low".


The rebound yesterday was weak because it was unable to make a higher high than the previous day. We see two consecutive red days, that invalidated my call for "1422.40 short term target met without testing 1397.68 low".
[1386.00 - 1396.60] zone - the Fib23.6/38.2 of the rally from 3/6/12 to 3/19/12 and the confluence of the 3 rising-trend lines, I expect it as a hard support.

3.21.2012

May be 1422.40 short term target met without testing 1397.68 low

I don't rule out the possibility yesterday's low 1397.68 could be revisited. However I expect a higher possibility that the market will head to the short term target 1422.40 without 1397.68 tested.


3.20.2012

The hard defensive supports would be 1385-1390 in case of a pullback

If market goes pullback, I expect the hard defensive supports at 1385-1390. It would be very good opportunities to add long positions.
The next short term target will be around 1422.40.
It was very interesting that my target estimation 1414 was exactly met by the high of yesterday's rally.

3.19.2012

1381-1390 may be the defence lines of bulls

The continuous rally from 3/7/2012 looks extended and a pullback is normal. I expect to reopen my long positions at 1381-1390.

3.14.2012

A new high may be imminent

10.40am
Seems to me that a profit taking at this new high is developing. Better to close some of your long positions to protect profits.
I will be in a tour for Cambodia, my neighbor country, for 4 days.
Will be back to my blog on Monday 3/19/2012.
Success trading to all my blog's visitor.

Not much to say besides that a new high I believe is imminent. My estimation is about 1414-SPX.

Trading plan for 3/14/2012
My bullish reading on charts proved right. No trying to suggest the top and not to be a front runner was the way helping me to make 24% from the beginning of the year.
I may target 1414 for short term. I don't intend to short at this high however closing some long positions is considered to make my money ready for another round of dip buying.

3.10.2012

Short term target could be 1379.40 and the defense lines would be 1366.50 - 1361.50

SPX daily
The price has been staying above the MA9 and MA for the 2nd day.

The price has also been staying above the Medium-term rising-trend-line for the 2nd day.

The price got back to the mini uptrend channel that hosts the W5.
All that urges me to expect that bull may continue it's way to make W5 extended.

Trading plan for 3/12/2012
When the trio (short+medium+long term) is in uptrend, I don't be bold enough to short the market at resistances. What I am doing is sticking with my long positions or to sell it at resistance and to find chances to buy on pullback.

If bull goes up directly from 1370.75, the target could be 1379.40.
If bull retreats, his defense lines would be 1366.50 - 1361.50

3.09.2012

The price has gotten back above the MA9 and MA20 that is a short-term bullish sign

SPX daily
Price got back above the medium-term rising-trend-line (pink). The price is also staying above the MA9 and MA20 that is a short-term bullish sign. The price may try to get back inside the mini rising channel which containing most of the time the W5/3/3/3. The question now is whether or not the W5 extended?
If W5 is extended, next target would be 1384 before it may be 1414.


Trading plan for 3/9/2012

A pullback at open would be a buy preparation.
A race at open would be a sell preparation, then a buy-back on dips would be considered.
Watch [1359.13 - 1363.62] and [1371.00 - 1376.17].


3.08.2012

The bounce may continue today to target [1358.40 - 1362.00]

The bounce may continue today to target [1358.40 - 1362.00] after the yesterday target 1353.85 achieved.
If today closes in green, bull's next target for Friday would be 1367-1368.


Trading plan for 3/8/2012
Rally, I may sell at [1358.40 - 1362.00] or higher today, however I will seeking to buy on pullback after I sell and hold it overnight.
Drop, I will buy only if [1345.50 - 1349.06] (my resistance box) is respected.

And the following is just my very subjective drawing for fun.


3.07.2012

1339.27 - 1336.58 may be the target of this pullback or wave-correction

10.11am
The bounce is steady.
I expect that selling only to happen at 1359 and that is very probable by tomorrow. 

1339.27 - 1336.58 may be the target of this pullback or wave-correction.
1339.27 is 50% correction of the W5 of W3.
1336.58 (corrected from 1335.30 as I posted yesterday) is 23.6% correction of the W3 starting from Dec 19, 2011.

Trading plan for 3/7/2012
Yesterday low was 1340.03 just an inch above the 1st target 1339.27 of bears.
We may expect a bear's visit of 1339.27 or of the yesterday's low 1340.03.
The rebound players may win today. Watching the resistances [1353.85 - 1359.03].

3.06.2012

An orderly pullback seen and that may lead to a correction of the W5

11.42am

The third day of this pullback becomes a sell off. This clearly results in a correction and I think we may apply this correction to the whole wave 3 that began from 12/20/2011. In this scenario we may expect the 1-st target of this correction is about 1335.30 (Fib 23.6) if the price is to close below the 1348.70. In this case, I would better be waiting to play the possible rebound by tomorrow at 1335.30. 
The contrary if SPX can close itself above 1348.70 today, a rebound at open tomorrow is very probable.


The pullback is orderly and bulls need to fight hard today to make a viable rebound from [1356.20 - 1359.13] otherwise the ball will belong to bears who would lead a correction targeting 1348.70 +/-0.10.

Trading of 3/6/2012
A rebound before a touching of [1356.20 - 1359.13] is a sell.

3.04.2012

A higher high than 1378.04 is possible, however if Monday close below the level 1362, then bull will need the support of 1359

SPX weekly
My reading still favors the bulls for an extended time, may be till May 2012.
SPX hourly
A close watch at this chart shows that the price is respecting the lower line of the mini-rising-channel (light blue color) and also the green rising-trend line is supplying a support for this upward movement.

Trading setup for 3/5/1012
A break out of the upper violet line will favor a higher high.
A breach of the lower yellow line may trigger a visit of 1362. A rebound from ~1362 is a buy and hold for the next day.
A Monday close below 1362 may need a support of the bullish flag pattern and the green rising-trend-line at about [1359.00 - 1359.50].


3.02.2012

May be another tedious day of buy on dip for the target 1380

Nothing new to say besides to repeat tediously the tactic buy on dip as long as the mini uptrend channel (light blue color) is respected.

Meanwhile the medium-term trend is up

3.01.2012

The uptrend channel holds firmly, intraday high was just missing 2 points from my target 1380

12.05pm
I think we will have another up-day if SPX closed today within the box [1370.50-1375.00]. In that case 1378 will be tested and 1380 may be achieved.

The uptrend channel holds firmly, intraday high was just missing 2 points from my target 1380, meanwhile the selling force gives us a warning sign ahead of a possible consolidation or pull-back.
An alternative viewpoint may say a drop day like yesterday is healthy for bulls as long as the uptrend channel is respected.

Trading setup for 3/1/2012
A dip that respects [1359.20-1363.30] is a buy.