6.30.2012

A rising wedge with resistance at about 1383.xx for next week

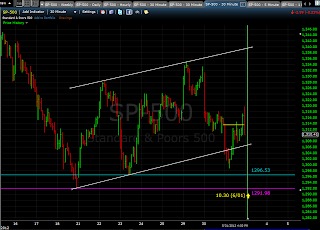
SPX 30min
The counter-trend rally might not over yet because of Friday's rally is huge. I favor the odds a higher than 1363.46 would be seen next week. However, because I see a rising wedge that began from 1334.93 and 1266.74 (violet lines), I think the zone [1380.xx - 1383.xx] where bulls may be defeated or win next week will be very critical.

If my favorite scenario becomes truth, the counter trend rally that began from 1266.74 may be a double Zigzag and the [A][B][C] of this rally may end somewhere around [1380.xx - 1389.07].

If price falls hard next Monday that potentially takes away 1334.40, bears may raise the odds that the wave 2 made from ABC (A?B?C? - in my chart) has finished (This case also means [A][B][C] has finished and [C]=1363.46).


SPX hourly
Watching the chart from a bigger time frame, I know that bears should be over if bulls win 1395.00 any day in July.


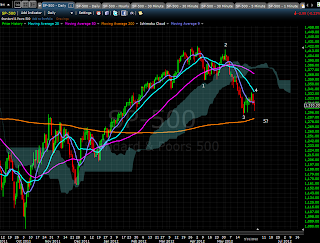
SPX daily indicators
3 indicators in the chart are bullish. Stochastics looks from neutral to slightly bullish.

SPX medium term: http://cyclestockmarketwinner.blogspot.com/p/spx-medium-term.html

My trading plan 
As long as the zone [1380.xx - 1389.07] is still ahead and no deeper than -1% fall seen, long on pullback would be my choice.

6.29.2012

Wave 2, when made from ABC formation like this, can be somewhere between 1342.76 and 1351.86

SPX 30min
My suggestion yesterday "A downward move that breaks 1322.06 would accelerate the fall to 1315.10, then 1309.27was correct more than 60% when price made the day's low at 1313.29.

With price reclaimed back almost the day's losses in the last hour of trading, the counter-trend rally may not over yet. Today's index future warns a gain more than 1%. These signs give a strong support that the wave 2 of this counter-trend rally will be made of an ABC form.
I expect that wave C will end at somewhere between 1342.76 and 1351.86.
I also don't rule out a possibility that wave C can be somewhere a bit short of 1363.46.

SPX daily indicators
Only MACD looks slightly bullish. 3 other indicators are still bearish looking.


6.28.2012

A downward move that breaks 1322.06 would accelerate the fall to 1315.10, then 1309.27

SPX 30min
For the yesterday forecast, I should have better noticed that wave 1 had finished and we were seeing a wave 2 underway because price had gone outside the descending channel.
I had made a correction call at 11.35am Update
"It is more likely I have to apply an alternative count, Wave 1 (= wave (5)) is already in and we are seeing Wave 2 which can be anywhere between 1336.50 and 1343.00."

For today, besides the odds opening for one more push up in wave 2, I set my short trigger at 1322.06 break down.

6.27.2012

I expect price will fall soon today to unfold wave (5). Maximum bulls could do is to revisit the yesterday high at 1324.24 or 1326.20

11.35am Update
It is more likely I have to apply an alternative count, Wave 1 (= wave (5)) is already in and we are seeing Wave 2 which can be anywhere between 1336.50 and 1343.00.


Please visit my "SPX medium term" tab in this blog.

SPX daily indicators
We have 3 among 4 indicators are bearish crossover. One more down day would confirm MACD bearish crossover.

SPX 30min
I expect the wave (C) of this summer correction will be divided by 5 waves.
Seems that we are in the final stage of wave (4) inside the impulsive wave 1 down. Wave (4) has been confined by a ascending broadening wedge, which is bearish.
I expect price will fall soon today to unfold wave (5). Maximum bulls could do is to revisit the yesterday high at 1324.24 or 1326.20 (38.2% retracement of wave (A)).
The minimum target of wave (5) will be 1307.23, however it could be anywhere from 1307.23 to   1296.72.

6.25.2012

Probably that the index is in the forming its final corrective wave (C) of the Elliott wave correction pattern ABC.

SPX daily
Probably that the index is in the forming its final corrective wave (C) of the Elliott wave correction pattern ABC that I symbol (A)(B)(C).
For the size and time duration of the correction forecast, please visit the Tab "SPX medium term".


SPX 30min
A bounce if any today is extending from the yesterday's intraday-bounce would face a resistance at 1322.06 being the 23.6% retracement of 1363.46 to 1309.27. A next resistance will be the low of  6/21/12 at 1324.41.
On the downside, a fall today would find a support at 1303.xx be the confluence of 61.8% retracement of wave (B) and 23.6% retracement of wave (A).

6.24.2012

What would be the size and the duration of this summer correction?

SPX medium term
We are in the 4th summer since the markets bottomed in 2009. If we pay attention to the size (better in percent scale) of the summer corrections and their duration, we have following figures of SP-500 to perusal.
2009 summer: (956.23-869.23)/956.23*100 = 
9.1%, duration 18 trading-days.
2010 summer: (1219.80-1010.91)/1219.80*100 = 
17.1%, duration 47 trading-days.
2011 summer: (1370.58-1074.77)/1370.58*100 = 21.6%, duration 108 trading-days
!
2012 summer:  The correction got 10.9% to its lowest point (A) and has been undergoing

57 trading-days since 4/3/2012 till 6/22/2012

An inference based on extrapolation of data may hint a further correction and more time are needed to see the bottom of this summer.


If the corrective wave (C) has the same size as wave (A), the target would be 1363.46 - (1422.38-1266.74) = 1207.82The duration of wave (A) was 43days. Suppose the same duration applied to wave (C), then I expect this summer correction would end at around August 20.


If the correction takes all its way down to touch and respect the lower-line of the bullish channel, 
the target should be between 1126.57 and 1115.xx depending on how long this correction terminates.


SPX 30min
To favor the reading that the fall since 4/2/2012 will unveil an Elliott wave (A)(B)(C) pattern correction, I believe the 50days MA (1346.00) will be a hard resistance in case extended bounce next Monday.
If the price falls, the supports will be 1318.xx=78.6% of C and 1315.43=50% of (B).


6.22.2012

A rebound if any will face resistances [1335 -1336] the confluence of the 50% of wave C and the neck-line of the failed H&S model. The next very strong resistance will be 1346 - the 50days MA.

SPX daily indicators
RSI is still bullish. Stochastics, MACD and DI+ showed a top. Stochastics is about to cross down the signal line the same as DI+ is about to cross down the DI-.
These reading issued a warning sign to bulls.
Elliott wave reading from 30min chart
The price fell sharply (2.23%) yesterday, took away more than 62% of the rise from 1306.62 to 1363.46. Not only crossed down the neck-line of the H&S model, it also deeply crossed down the rising wedge - violet lines. That seems to say the trend might had changed and the ABC counter trend rally might had finished with C printed it's value at 1363.46 on 6/19/12.
A rebound if any will face resistances [1335 -1336] the confluence of the 50% of wave C and the neck-line of the failed H&S model. The next very strong resistance will be 1346 - the 50days MA.
Yesterday's price fall below 1335.52 would be a nullification of my alternative attempt to count the rise since 6/4/12 as impulsive. 

6.21.2012

Wave 5/3 (or 5/C) if it can be made of from a rebound today and tomorrow may target 1367.xx or 1381.xx.

SPX daily indicators
All indicators look bullish and none of them revealed overbought.

Elliott wave reading from 30min chart
Price could be either in the forming of wave C (final state of a counter trend rally - bearish scenario) or in the forming of wave 3 of an impulsive 5 waves up (bullish scenario).
The internal wave structure seems that the movement since 11am of 6/12/12 till now had revealed 4 waves of a 5 waves structure. Wave 4/3-bullish (or 4/C - bearish) had probably finished at 1346.45 - the yesterday's low. If that was correct, then I expect to see a following rebound today to form wave 5/3 (or 5/C).
Wave 5/3 (or 5/C) if it can be made from a rebound today and tomorrow may target 1367.xx or 1381.xx.

6.20.2012

The internal wave structure seems that the movement from 11am of 6/12/12 till now had revealed 3 waves of a 5 waves structure

SPX daily
Traditional reading reveals that the index is in a short-term bullish status as RSI, Stochastics, MACD and DI  indicators demonstrated. None of these indicators hints an overbought.
Also the price has crossed up the 50 days MA - a sign that encourages buying.

However, the market is still in a long-term bearish status as long as the trend-line (Yellow), that connects the highs of 4/2/12 and 5/1/12, is still respected.


Elliott wave reading
Either case: The price is in the forming of wave C (final state of the counter trend rally - bearish scenario) or the price is in the forming of wave 3 of an impulsive 5 waves up (bullish scenario).
The internal wave structure seems that the movement from 11am of 6/12/12 till now had revealed 3 waves of a 5 waves structure. Wave 3/3 (or 3/C - bearish scenario) had probably finished at 1363.46 - the yesterday's high. If that was correct, then I expect to see a following pullback today to form wave 4/3 (or 4/C).
This pullback if any would find supports around [1346.90 - 1352.00].
The rebound following to form wave 5/3 (or 5/C) would likely to target [1372.xx - 1389.xx].


6.15.2012

SPX hourly
Bulls were strong and it's likely that wave B was finished in the ABC form retracement.
With Europe markets in strong rebound and US-premarkets up more than 0.25%, It is very probable for today that the index will advance to target 1344.56 the retrace 50% of the fall from the height of 4/2/12 to the low of 6/4/12.
Price may advance further next week before the finish of wave C if markets get supporting events from Eurozone.

SPX 30min


6.14.2012

The anxieties about Eurozone problems will likely pull the SPX lower today and Friday to around 1300.xx.

7.00am update
I've just found this new on http://finance.yahoo.com/news/greek-bank-stocks-surge-pro-102539457.html?l=1
"Greek bank stocks surge on pro-bailout optimism ahead of vote

ROME (Reuters) - Greek banking stocks surged on Thursday, rising over 20 percent amid market talk that secret opinion polls were showing that a government favorable to the international bailout agreement was likely to emerge after the June 17 election.
"The market sees that a pro-European government which will push ahead with reforms will be formed on Sunday," Panagiotis Kladis, an analyst at NBG Securities told Reuters.
Another broker said the market was trading the scenario that the radical leftist SYRIZA party, which opposes the European Union and International Monetary Fund-led bailout deal, would not gain enough support to form a government.
The main bank stocks index (.FTATBNK) stood 20.08 percent higher at 218.2 at 0615 EDT, outperforming the broader market (.ATG), which was up 6.85 percent.
Greek law forbids the publication of opinion polls in the two weeks before elections.
(Reporting by Lefteris Papadimas and George Georgiopoulos)"
I consider trading based on this news is a speculation. However, if the index closed today in green and no lower than 1306 found on Friday, this speculation may become truth.

~~~~~~~~~~~~~~
The anxieties about Eurozone problems will likely pull the SPX lower today and Friday to around 1300.xx.
The index may find a strong support at 1292 and might be wandering around 1300.xx on Friday waiting for events from Eurozone on Monday to decide it's direction for next week

I would like to quote the chart I posted on Tuesday 6/12/2012 showing two different scenarios.
Both scenarios suggested that a bounce would be caped by 1326.xx following by a pullback to 1300.xx.

6.12.2012

A rebound if happens would target 1326.xx

SPX hourly
The rebound from 1266.74 to 1335.52 can be either
1. A trend change or
2. A part of the corrective bounce that would make ABC pattern (wave 2) of a bigger bearish market started from 4/2/2012.

SPX 30min
The pullback yesterday looks as a part of the corrective of the move from 1266.74 to 1335.52.
This may make the a?b?c? pattern as showed in the chart.
Bulls can win the high of yesterday 1335.52 or not depends all on what will happen in Greece.

6.08.2012

A pullback may happen and target [1298.90 - 1304.00] zone. However if this zone is respected, I expect that the next rebound will push price up to 1345.xx.

SPX
I would like to repeat the yesterday post: "Ideally, it would be an advance to 1326.50, then a pullback to 1304.00 and a rebound to target 1345.10".
A pullback may happen and target [1298.90 - 1304.00] zone. However if this zone is respected, I expect that the next rebound will push price up to 1345.xx.


SPX bullish reading from mix-points
1. RSI14 got into bullish territory by printing 53.51 value and broke out the descending trend line.
2. Stochastics bullish crossover.
3. MACD bullish crossover with the 1ST MACD Histogram bar in green that hints a few green bars can be expected.
4. In the worst scenario of Elliott Wave Theory that the correction began since 4/2/2012 is not over yet, this bounce (from 6/5/12) is marking the end of the first 5-waves correction and it normally is an ABC bounce pattern. The yesterday 1329.05 - high would be A, B would be the low of the pullback (may be made on today or by next Monday), C could be somewhere around 1345.xx.

6.07.2012

If bulls can pay a visit to 1326.50, then any pullback will be a buy opportunity for the target 1345.xx next.

Correction: "If...next" must be understood as "If bulls can pay a visit to 1326.50, then any pullback that respects [1298.90 - 1304.00] will be a buy opportunity for the target 1345.xx next."


SPX
Ideally, it would be an advance to 1326.50, then a pullback to 1304.00 and a rebound to target 1345.10
If bulls can pay a visit to 1326.50, then any pullback will be a buy opportunity for the target 1345.xx next.

6.06.2012

Can this rebound be compared to the 5 days' rebound of 5/21/12?

SPX daily
The 2 months' correction (Bears) took away 12.28% off the price from the top may need time to breather.
Although Stochastics and MACD are still in oversold condition, the RSI indicator is showing some positive divergent meanwhile the price is trying to get back above the 200days MA.
I would like to recall my saying about T2108 posted 6/04/2012:
"The 2108 indicator is too oversold and that may hint a big bounce is imminent.
T2108 - % Stocks Above 40 Day Pma
The indicator's reading is 18.64. Remember that the indicator was 16.31 on 5/18/2012 before a 5 days' bounce."


Elliott view
It seems that 1266.74 - the low of 6/4/2012 was the end of the 5 waves correction since 4/2/2012. 

The correction was done yet? I am not sure! I need to see price going outside the yellow trend-line and staying above 1300 level to be sure about it.

6.04.2012

The 2108 indicator is too oversold and that may hint a big bounce is imminent.

T2108 - % Stocks Above 40 Day Pma
The indicator's reading is 18.64. Remember that the indicator was 16.31 on 5/18/2012 before a 5 days' bounce.
SPX daily
The decline since 4/2/2012 can be counted as a 5 waves correction and it seems that wave 5 is about to finish. If this becomes real we may see a huge bounce at the end of wave 5 around 1260.

6.01.2012

For next 2 weeks, Bears may target the 200 days moving average to finish 5-waves Elliott pattern

SPX
With very weak manufacturing data reading from China and Europe Countries including England. Bears will definitely target the 200 days moving average, which is about 1282 - 1284.
Elliott wave count can then be 5-waves pattern if bears can be successful reaching 1282 - 1284.
Trading plan
SPX could sink deeply at open as what Europe markets and US-futures are showing but It may be halted at somewhere between 1296.53 and 1291.98 and a bounce may be found.