4.29.2012

Traditional view:
SPX daily looks very bullish. If a pullback is starting next Monday, 1384.xx - are expected to make a strong support zone because it is a confluence of short and mid terms moving averages together with the upper edge of the Ichimoku Cloud and the Fib50 from the low of 4/23 to the high of 4/27.


Bearish Elliott view (Just a repeat of what I said in the Friday post):
The price seems to make an ideally 5 waves structure of the wave (C) with its value placing between Fib61.8 & 78.6 of the (A)(B)(C) counter trend rally and still opens the possibility to a further and steeper sink to form the wave C of the correction ABC which began from the April 3.
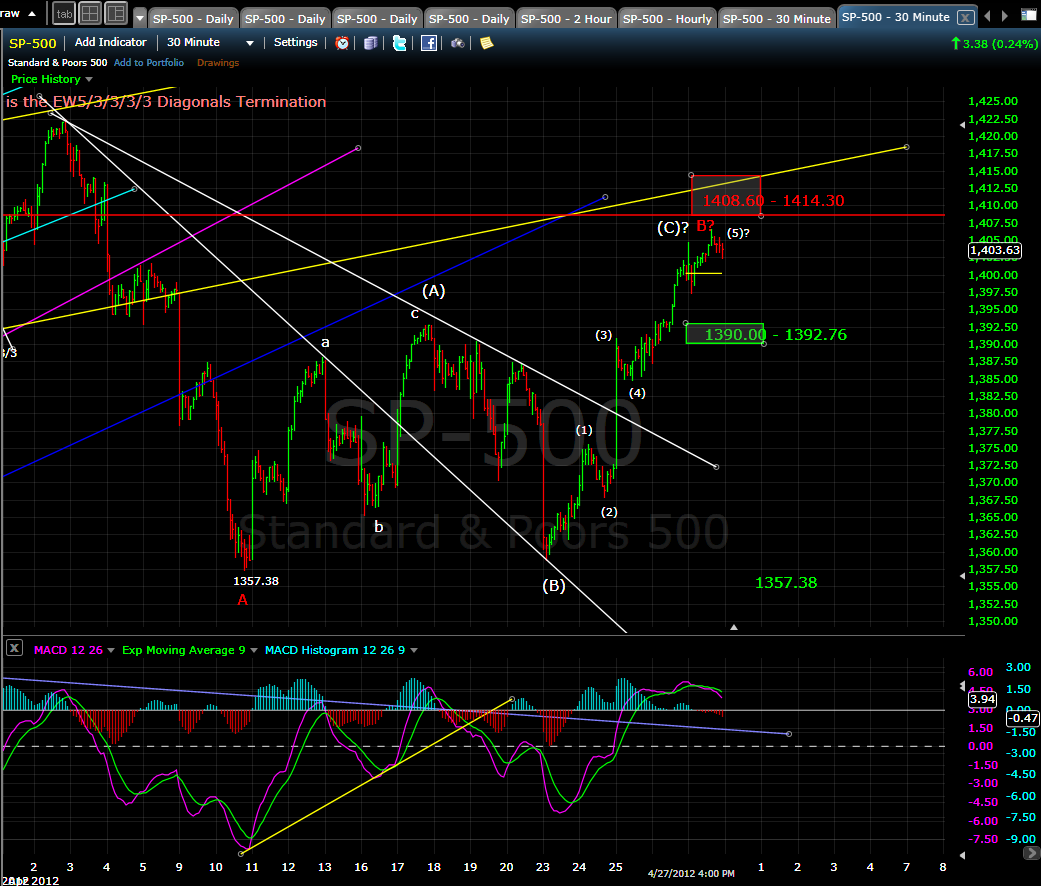

Bullish Elliott view?
The 5 days drop from the April 3 was just a deep pullback and it was not a part of a correction. The rally began from the 4/24 might be the first motive of the five wave pattern up.

4.27.2012

Bullish however still opens till Monday the possibility of a resuming of the correction

10.45am
May I say it's safe for bulls because the Spain's downgrade couldn't spook the Europe markets?


Bullish traditional view:
The price made three consecutive up days, it has broken up the short and mid-terms moving averages (9, 20 & 50 days). The price had found a good support from the Fib 78.6 level of the pull back. It also found a strong support from the Ichimoku Cloud. Seemingly it wants to make a Double Bottom.
Some indicators that confirm the bull after the Thursday's close can be mentioned: RSi14 has crossed its MA7 for two days and is backed to the positive territory > 50. Stochastics made a W bottom and crossed up the signal %D5. MACD crossover through the signal line.

Elliott bearish view
The price seems to make an ideally 5 waves structure of the wave (C) with its value placing between Fib61.8 & 78.6 of the (A)(B)(C) counter trend rally and still opens the possibility to a further and steeper sink to form the wave C of the correction ABC began from the April 3.
To support this bearish view the index needs to drop hard by Friday to send the index to about 1380.00 in a single day (Or making almost no progress Friday and sharp drop on Monday).
Day trade
Bulls may buy on consolidation or minor pullback for [1408.60 - 1414.30].
Bears may be looking for a sharp drop to 1380 to initiate a short.

4.26.2012

If price continues to go up today, it could be the final push up to form wave (5) of the (C). So, this wave might be limited by the Fib61.8 of the retracement at 1397.40.

9.14am
The risk to short to follow the drop at open (no higher than 1392.76 made before the drop) is the possibility to form wave (4), then a rebound to form wave (5) at a high higher than 1392.76 - This is a perfect wave (C) (the numbering inside the wave (C) is different between my two charts) 
So in this case bears better target not further than 1380.00.

  
SPX
A strong counter trend rally according to the Elliott theory and it could be the final push up to form wave (5) of the (C). So, this wave might be limited by the Fib61.8 of the retracement at 1397.40.


Day trade:
Price continues to go up today: It may be too late to follow?
Price crosses down through 1390.00: It may be a sell for the targets [1376.30 - 1380.00].

4.24.2012

A push up will face a hard resistance zone [1376.30 - 1380.00] - it's the intersection/confluence of resistance lines:..

12.00am
Vigorously back inside the bear flag! I don't know how does FOMC statement will affect the next movement of the market besides bull looks very ambitious. I may need to renumbered the EWs and bias more on bulls for higher high.


Maintain my call for a mid-term correction with a possible duration 4-8 weeks and a probable target 1312.xx. This call subjected to nullification if bulls win 1422.38.

I am not satisfy with my Tuesday call "A bounce would be limited by [1372.30 -1374.30] and I consider it as a good chance to sell". It made only 4 points on the pullback from 1372.30 to 1368.30. It is the wave (4) as I marked on the chart. And as the price evolution and Elliott waves showed it should be considered as day trades only. A short at wave (3) and keeping overnight will face a risk by the wave (5).


Seems that bulls will try another push up? That if happens will form wave (5) of the bounce began from April 23 and it will face a hard resistance zone [1376.30 - 1380.00] - it's the intersection/confluence of resistance lines: The lower line of the bear flag, the descending line connecting heights of April 17 & 19, The  lower line of Andrew's Pitchfork, and the Fibonacci 61.8% of the April 23' low and April 17' high.

Trading:
Depending on how markets open, wave (5) followers may play the upside with a note in mind that W5 is normally shorter than W3.
It may be a better chance to short if [1376.30 - 1380.00] is respected.
In case of a sharp drop at open, I will watch [1357.60 - 1361.00] for supports.

A bounce would be limited by [1372.30 -1374.30] and I consider it as a good chance to sell. A further drop is expected and might find a short term support at [1350.00 - 1354.00].

Maintain my call for a mid-term correction with a possible duration 4-8 weeks and a probable target 1312.xx. This call subjected to nullification if bulls win 1422.38.


EURUSD sold off Monday and couldn't make a noticeable bounce today, so the Diamond Bottom I suggested failed. That would negatively affect US markets.

SPX: The bear flag model came to maturity Monday and the sharp price fall was a confirmation. Talking the Elliott wave, the pullback from the high of Friday (4/20/2012) and fueled by a sharp fall Mondays looks as a beginning of the Wave 3 of the Correction Wave C (of the correction ABC).

Trading: A bounce would be limited by [1372.30 -1374.30] and I consider it as a good chance to sell.
A further drop is expected and might find a short term support at [1350.00 - 1354.00].