SPX daily looks very bullish. If a pullback is starting next Monday, 1384.xx - are expected to make a strong support zone because it is a confluence of short and mid terms moving averages together with the upper edge of the Ichimoku Cloud and the Fib50 from the low of 4/23 to the high of 4/27.

Bearish Elliott view (Just a repeat of what I said in the Friday post):
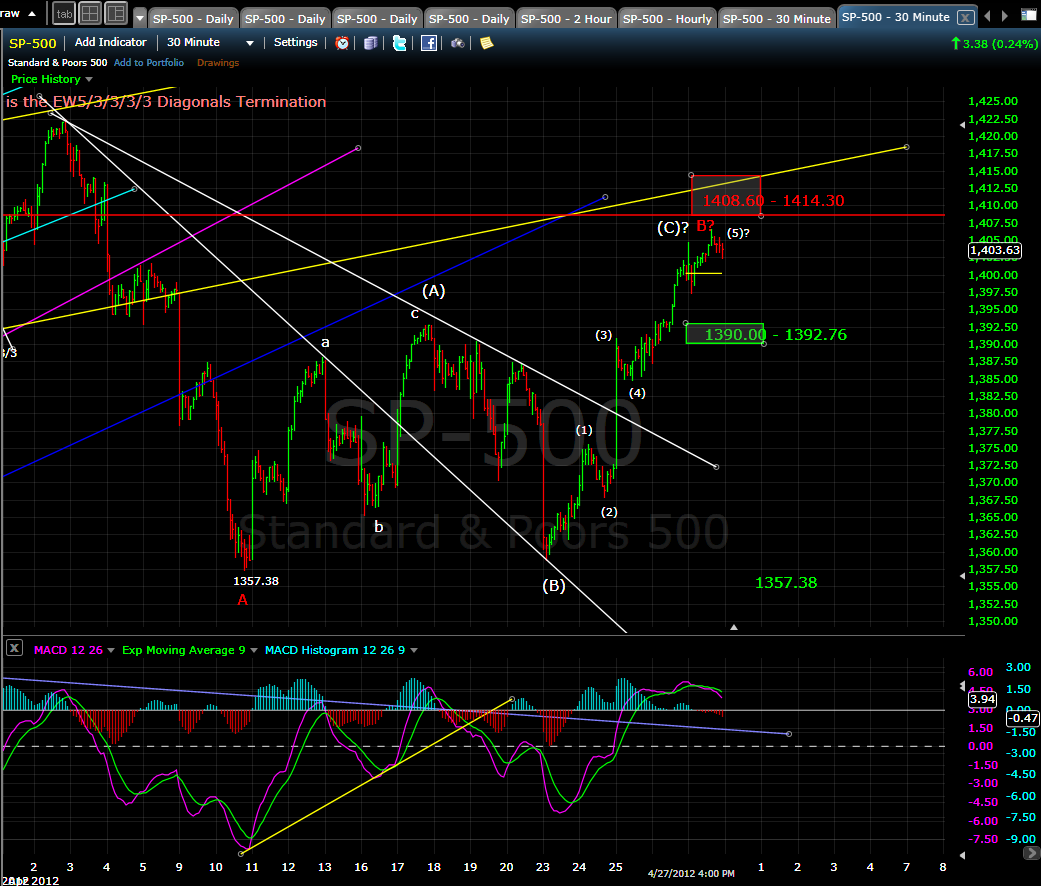
The price seems to make an ideally 5 waves structure of the wave (C) with its value placing between Fib61.8 & 78.6 of the (A)(B)(C) counter trend rally and still opens the possibility to a further and steeper sink to form the wave C of the correction ABC which began from the April 3.
Bullish Elliott view?
The 5 days drop from the April 3 was just a deep pullback and it was not a part of a correction. The rally began from the 4/24 might be the first motive of the five wave pattern up.


